Timeline Infographics: Choosing, Using, and Avoiding Common Pitfalls
When it comes to presenting information in a clear, engaging way, timeline infographics are an invaluable tool. Whether you're a marketer building a brand story, a teacher explaining historical events, or a freelancer pitching a project plan, a well-designed timeline can turn complex sequences into digestible visuals. The Timeline Infographics package—offering an AI file, EPS10 file, and high-quality JPG—gives users flexibility and quality for both digital and print use. But even with top-notch resources, users often make mistakes that reduce the effectiveness of their work.
Why Timeline Infographics Matter
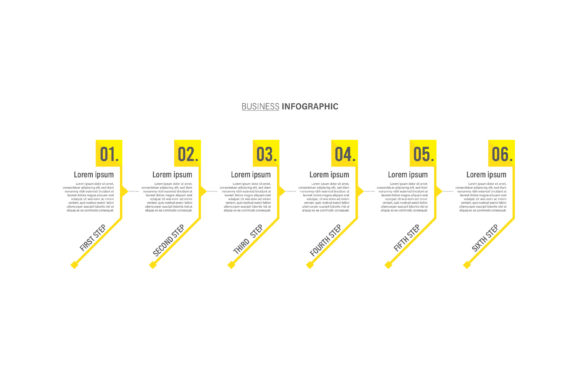
Visual storytelling has become essential in today’s fast-paced digital environment. A timeline infographic helps organize events chronologically, making it easier for audiences to follow and remember key points. With the Timeline Infographics download, users gain access to fully editable vector files that allow customization without loss of quality. This makes it a popular choice for professionals who need polished visuals quickly.
Common Mistakes When Using Timeline Infographics
Despite the benefits, many users fall into traps that limit the impact of their designs. Understanding these pitfalls can help you make the most of your Timeline Infographics package and avoid unnecessary frustration or wasted effort.
1. Overloading the Timeline with Information
One of the most frequent errors is trying to include too much detail. While it’s tempting to pack in every event or data point, this can make the timeline cluttered and hard to follow. The goal of a timeline infographic is clarity, not complexity.
Better approach: Focus on the most important milestones or events. Use the editable nature of the AI and EPS files to simplify design elements and highlight key moments visually.
2. Ignoring Visual Consistency
Many users don’t realize how important it is to maintain visual harmony across the timeline. Mixing fonts, inconsistent icon styles, or mismatched color schemes can distract from the message and make the design look unprofessional.
Better approach: Stick to a consistent design language. Use the vector files to adjust icons, fonts, and colors uniformly across the entire timeline. This helps maintain a clean, cohesive look that supports your message.
3. Using the Wrong Format for the Platform
The Timeline Infographics package includes multiple formats—AI, EPS, and JPG. However, some users download the JPG version and try to scale it for print or editable use, which leads to pixelation and poor quality.
Better approach: Understand what each file type is best for. Use the AI or EPS files when you need to edit or scale the design for print or web. Use the JPG only for quick previews or when no editing is needed.
4. Not Planning for Scalability
Some users select a timeline design that looks good at one size but doesn’t scale well. This can be a problem when repurposing content for different platforms—like moving from a website to a printed poster or presentation slide.
Better approach: Choose a timeline layout that allows for flexibility. Vector files from the Timeline Infographics package are ideal because they can be scaled without losing resolution. Always test how your design looks at different sizes before finalizing.
5. Underestimating the Power of White Space
White space is often overlooked, but it plays a critical role in readability. Crowded timelines with little breathing room between elements can overwhelm the viewer and reduce comprehension.
Better approach: Use the vector editing tools to adjust spacing and layout. Ensure each event or milestone has enough room to stand out without competing with surrounding elements.
What to Check Before Downloading or Customizing
Before diving into your Timeline Infographics package, take a moment to review the following to ensure you get the best results:
- File Compatibility: Make sure your design software supports AI or EPS formats if you plan to edit the files. Adobe Illustrator is commonly used, but other programs may require conversion.
- Resolution and Quality: For print use, always work with vector files to maintain sharpness. If using the JPG version, check the resolution to ensure it meets your needs.
- Licensing: Confirm that the package includes commercial use rights if you plan to use the timeline in a professional or client-facing project.
- Editability: Test the files to ensure you can modify colors, fonts, and layout elements to match your brand or project style.
How to Maximize the Value of Your Timeline Infographics
Getting the most from your Timeline Infographics package isn’t just about avoiding mistakes—it’s about using the tools strategically to enhance communication and engagement.
Use Cases That Work Well
- Business Presentations: Show company milestones, product development phases, or marketing campaign timelines in a visually appealing way.
- Educational Materials: Help students grasp historical events, scientific processes, or project-based learning with a clear visual structure.
- Website Content: Use timelines to explain your brand story, service process, or industry evolution in a way that’s easy to scan and share.
- Social Media: Break down complex information into digestible, shareable visuals that grab attention and communicate clearly.
Final Tips for Best Results
- Start with a clear objective: Know what story you want your timeline to tell before selecting or customizing a template.
- Test on different devices: Especially if using the timeline on a website or in a digital presentation, ensure it looks good on both desktop and mobile screens.
- Get feedback: Share your design with a colleague or peer before publishing to catch any layout or readability issues.
- Keep a backup: Save your original AI or EPS file so you can revisit and edit the design in the future without starting from scratch.
With the right approach, the Timeline Infographics package becomes more than just a design tool—it becomes a powerful asset for communication, education, and storytelling. Avoiding common mistakes and understanding how to use each file type effectively ensures you get the most value from your investment, both in time and quality.