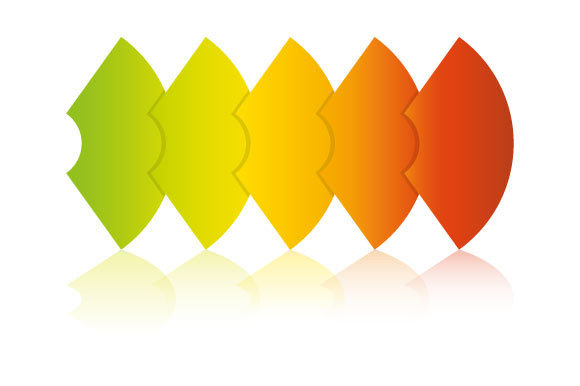
Colorful Process Diagram Infographics: Choosing and Using Them the Right Way
Visual communication is a powerful tool, especially when explaining complex processes or workflows. Colorful Process Diagram Infographics offer a vibrant, flexible, and scalable solution for professionals and creators across industries. Whether you're a marketer designing a presentation, an educator simplifying a lesson, or a freelancer building a portfolio, these infographics can enhance clarity and engagement. But like any design asset, they come with potential pitfalls if not used thoughtfully.
Understanding the Value of Colorful Process Diagram Infographics
These infographics are designed to break down multi-step processes into visually digestible parts. Each diagram is crafted in vector format, making it easy to scale without losing quality. The package includes multiple file types—AI, EPS, SVG, PDF, and high-resolution PNG with transparent backgrounds—ensuring compatibility across design platforms and use cases. Their colorful, modern aesthetic makes them ideal for both digital and print media.
Because they're vector-based, users can edit colors, shapes, and layout elements to match brand guidelines or personal preferences. This flexibility is especially valuable for those who may not have advanced design skills but still want professional results.
Common Mistakes When Choosing or Using These Infographics
Even with such a versatile product, users often make avoidable mistakes that can impact the final outcome. Here are some of the most common issues—and how to avoid them.
1. Overlooking File Compatibility
While the package includes multiple file formats, not every format works in all design software. For example, someone using Canva may not be able to open AI or EPS files directly. Assuming all formats are universally compatible can lead to frustration and wasted time.
Better approach: Check which file types your software supports before downloading or purchasing. SVG and PDF files tend to be more universally accepted, while AI and EPS are best for Adobe users.
2. Ignoring the Importance of Resolution
Although the PNG files are high-resolution, they're still raster images. Scaling them too large can cause pixelation, especially in print or large-format presentations. Vector formats like SVG or AI avoid this issue entirely, but only if you're using the right tools.
Better approach: Use vector files when possible, especially for projects that may need resizing. If you must use PNG, ensure the original file is at least the size you'll need in your final design.
3. Underestimating the Need for Customization
Many users assume they can drop a diagram into a design and it will immediately match their style. In reality, colors, fonts, and layout may clash with your existing branding or presentation theme.
Better approach: Choose infographics that allow for easy editing. Since these diagrams come in editable vector formats, take the time to adjust colors and elements to align with your visual identity.
4. Misjudging the Complexity of the Diagram
Some users select a diagram based on aesthetics alone, only to find it's either too simple or too complex for their needs. A diagram with too many steps can overwhelm your audience, while one that's too basic may not convey the necessary information clearly.
Better approach: Match the diagram complexity to your content. If needed, combine multiple diagrams or simplify existing ones using the editable vector files.
What to Check Before Downloading or Using These Infographics
Before incorporating Colorful Process Diagram Infographics into your project, consider the following:
- Software compatibility: Will your design tool open AI, EPS, SVG, or PDF files?
- Intended use: Is this for print, web, or presentation? High-resolution PNGs may be sufficient for slides, but vectors are better for scaling.
- Customization needs: Will you need to change colors, icons, or layout? If so, vector formats are essential.
- Licensing: Ensure the infographic is licensed for your intended use, especially for commercial projects.
Maximizing the Benefits of These Infographics
To get the most out of these assets, consider these practical tips:
- Start with a clear message: Know what you want to communicate before choosing a diagram. This helps you select the most appropriate visual structure.
- Test on different backgrounds: Since PNG files come with transparent backgrounds, test how they look on light, dark, and patterned backgrounds to ensure readability.
- Use consistent spacing and alignment: Even with pre-designed templates, adjusting spacing and alignment can significantly improve visual appeal.
- Pair with complementary fonts and icons: Don’t rely solely on the visuals—use matching typography and supporting graphics to reinforce your message.
- Preview at actual size: Especially for print or large-format use, always preview your design at 100% zoom or actual size to catch any scaling issues.
When to Seek Alternatives
While Colorful Process Diagram Infographics are versatile, they may not be the best fit for every project. If you need highly specialized diagrams, custom illustrations, or interactive elements, you may need to explore other design options or hire a professional designer.
Also, if you're not comfortable with design tools like Adobe Illustrator or vector editing in general, you may find it easier to use pre-built templates within platforms like Canva or PowerPoint that already integrate with PNG files.
Final Thoughts
With the right approach, Colorful Process Diagram Infographics can be a game-changer for visual storytelling. They offer a balance of flexibility, quality, and aesthetic appeal that's hard to beat—especially for creators who need professional results without a steep learning curve.
By avoiding common pitfalls and understanding how to use each file type effectively, you can ensure your visuals enhance your message rather than distract from it. Whether you're presenting to a client, teaching a class, or launching a campaign, these infographics can help you communicate more clearly and confidently.