Visualizing Health: The Power of Wearable Technology Infographics
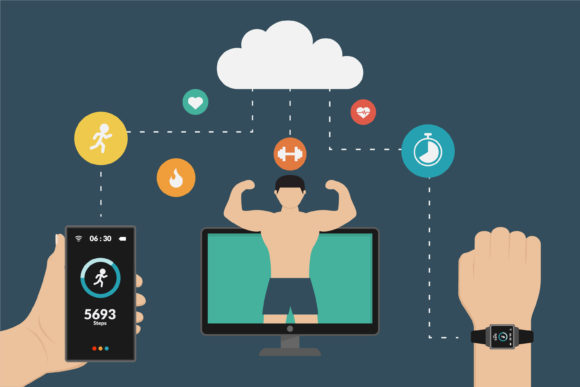
In a world where health tracking has become part of daily life, wearable technology infographics offer a clear, engaging way to understand the data these devices generate. From smartwatches that monitor heart rate to fitness bands that track sleep patterns, wearable tech has reshaped how individuals and professionals interpret personal health metrics. Infographics serve as a bridge between complex data and actionable insights, making them an essential tool for creators, marketers, educators, and healthcare professionals alike.
Why Wearable Technology Infographics Matter
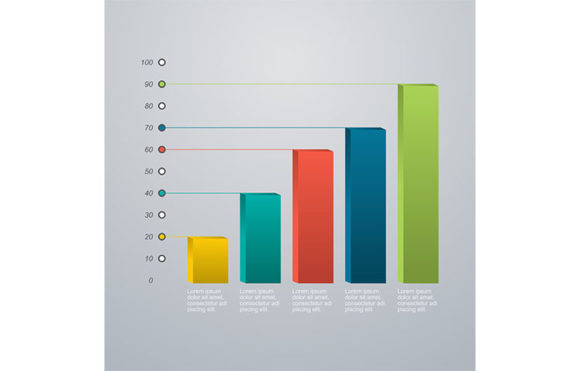
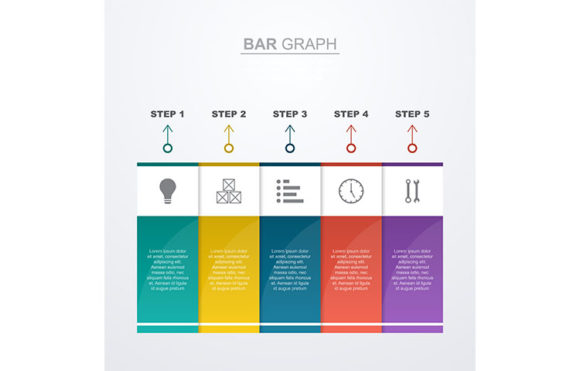
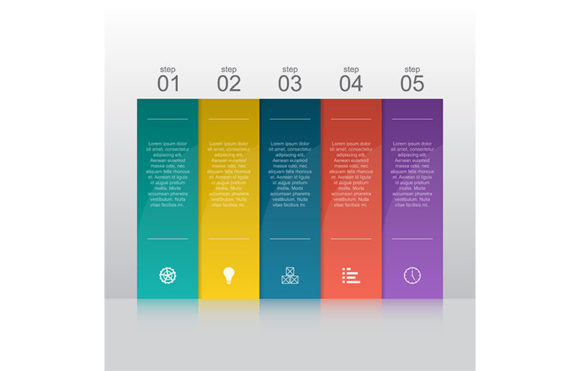
Wearable technology continues to grow in popularity, with millions of users relying on devices to track physical activity, nutrition, and even stress levels. However, raw data alone isn’t enough. It needs to be visualized in a way that’s easy to digest and share. This is where wearable technology infographics come in — transforming numbers and trends into compelling visuals that communicate health insights clearly and effectively.
For professionals in healthcare, marketing, and education, these infographics are more than just visuals. They’re communication tools that simplify complex information, support decision-making, and enhance engagement. Whether used in presentations, reports, or digital campaigns, they help convey the value of wearable technology in a way that resonates with diverse audiences.
Design Flexibility Meets Practical Use
One of the key advantages of wearable technology infographics is their adaptability. Designed with vector-based formats like AI, EPS, SVG, and PNG, these visuals can be easily customized to match brand colors, resize for different platforms, or modify for specific messaging. This flexibility makes them ideal for businesses and creators who need to maintain visual consistency across multiple touchpoints.
For example, a health tech startup might use a wearable tech infographic in a pitch deck to investors, then adapt the same design for a blog post or social media campaign. The ability to edit colors, icons, and layout ensures that the same base graphic can serve multiple purposes without losing clarity or impact.
How to Use Wearable Technology Infographics Effectively
- Educational Content: Schools, universities, and online educators can use these visuals to explain how wearable devices work and what data they collect.
- Marketing Materials: Brands can highlight features of their wearable tech products using clean, data-driven visuals that resonate with tech-savvy consumers.
- Health Reports: Medical professionals can integrate infographics into patient reports to illustrate trends in health metrics over time.
- Social Media: Platforms like Instagram and LinkedIn benefit from eye-catching visuals that summarize key health insights in a shareable format.
The Evolution of Wearable Tech and Its Visual Storytelling Needs
Over the past decade, wearable technology has evolved from basic step counters to sophisticated health monitors capable of detecting irregular heartbeats and blood oxygen levels. As these devices become more advanced, the need for intuitive visual explanations grows. Infographics help users understand what their data means and how they can act on it — whether it’s adjusting fitness routines, improving sleep hygiene, or consulting a doctor.
This evolution has also influenced user expectations. Today’s consumers don’t just want data — they want insights. They expect their wearable devices to provide meaningful, easy-to-understand summaries of their health. Infographics fulfill this need by presenting data in a format that’s both informative and visually engaging.
Designing for Customization and Scalability
Wearable technology infographics built with vector formats ensure that visuals remain crisp and clear, no matter the size or application. Whether displayed on a mobile screen or printed in a large poster, these graphics maintain their quality. This scalability is especially valuable for businesses and content creators who need to repurpose visuals across different media formats.
For instance, a designer working on a client’s health tech campaign can start with an SVG file for a responsive web page and export a high-resolution JPG for print materials. The ability to edit and adapt ensures that the infographic remains relevant and useful across platforms and audiences.
Choosing the Right File Format
Each file format offers unique benefits depending on the use case:
- AI (Adobe Illustrator): Best for deep customization and professional design work.
- EPS: Ideal for high-quality print and compatibility with various design software.
- SVG: Perfect for web use due to scalability and small file size.
- JPG: Suitable for general sharing and embedding in documents or presentations.
- PNG: Offers transparency and high quality, great for digital overlays and web graphics.
Practical Applications Across Industries
Wearable technology infographics aren’t just for tech companies. They have practical applications across a wide range of industries:
- Healthcare: Clinics and wellness centers use them to explain patient data trends and promote preventive care.
- Education: Teachers and curriculum designers integrate them into lessons about health, biology, and technology.
- Marketing: Agencies use them to highlight product features and user benefits in a visually compelling way.
- Corporate Wellness: Companies incorporate them into internal wellness programs to encourage healthier habits among employees.
Real-World Examples of Wearable Tech Infographics in Action
Consider a digital marketing agency creating a campaign for a new fitness tracker. Instead of relying solely on technical specs, they include an infographic that visually compares heart rate data from different activities. This not only makes the product more relatable but also helps potential buyers understand the real-world value of the device.
Another example is a wellness blog that publishes a weekly health summary using an infographic to show how wearable data can reveal sleep patterns and stress triggers. This kind of content builds trust with readers and positions the blog as a reliable source of health and tech information.
Conclusion: Making Health Data Accessible Through Design
As wearable technology becomes more integrated into everyday life, the need for clear, customizable infographics will only increase. These visuals are more than just tools for data presentation — they’re bridges between technology and understanding. Whether you're a designer, educator, marketer, or health professional, leveraging wearable technology infographics can enhance your ability to communicate effectively and make a lasting impact.