Process Diagram Infographics: Creative Clarity for Every Project
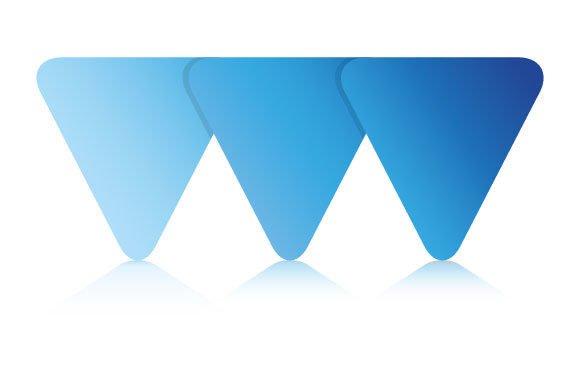
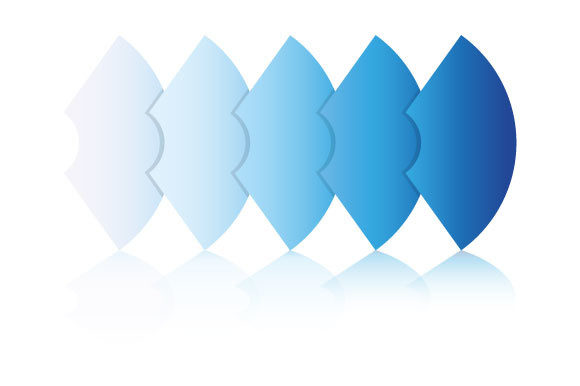
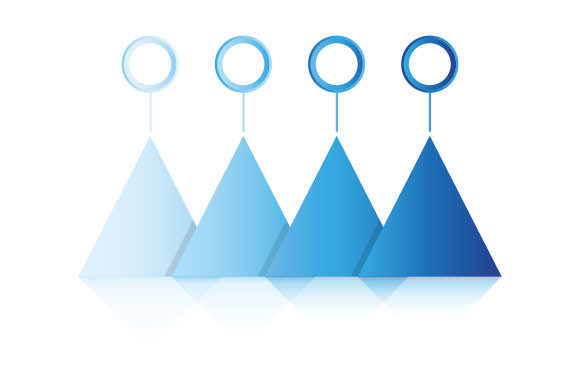
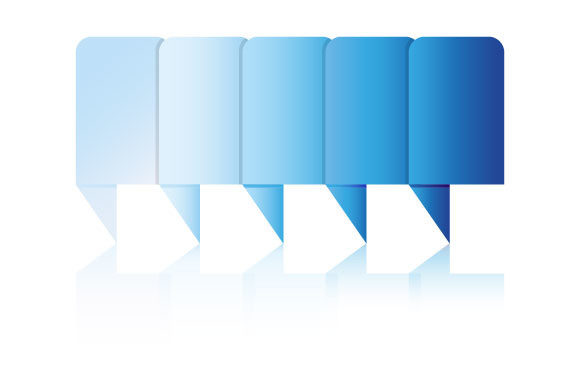
Visual communication is more powerful than ever. Whether you're explaining a complex workflow, mapping out a strategy, or teaching a step-by-step method, the right visuals make all the difference. That’s where Process Diagram Infographics come in. This versatile graphic package offers 100 vector-based templates designed for clarity, flexibility, and visual impact.
Each diagram is delivered in a zipped file containing AI, EPS, SVG, PDF, and high-resolution PNG formats with transparent backgrounds. This means you can scale them to any size without losing quality and integrate them seamlessly into presentations, websites, social media, or printed materials.
Why Process Diagram Infographics Stand Out
What makes these diagrams more than just another graphic asset? Their structure. Process diagrams break down complex sequences into digestible visual steps. Whether it's a five-step customer journey or a circular feedback loop, the design helps your audience follow along effortlessly.
Because they're built in vector format, you can edit colors, shapes, and labels to match your brand or project style. This level of customization ensures your visuals stay consistent across platforms while keeping your message clear and professional.
Creative Possibilities Across Industries
The beauty of Process Diagram Infographics lies in their adaptability. Here are just a few creative directions you can explore:
- Marketing – Visualize customer onboarding, content creation workflows, or conversion funnels.
- Education – Break down complex learning paths, curriculum structures, or scientific processes.
- Business – Map out strategic planning, decision trees, or operational steps.
- Design – Use them as layout elements in reports, dashboards, or app interfaces.
- Freelancing – Showcase your creative process or project timelines to clients.
From minimalist line art to bold, colorful visuals, you can reinterpret each diagram to suit your creative direction. Try layering them with icons or integrating them into animated explainers for digital use.
How to Use These Diagrams Effectively
Even the best graphics can fall flat if not used thoughtfully. Here’s how to make the most of your Process Diagram Infographics:
- Match the tone to your audience – Use soft colors and rounded shapes for approachable content, or sharp lines and bold hues for corporate presentations.
- Keep it uncluttered – Too many labels or visual elements can confuse the viewer. Stick to the essentials and let the diagram guide the eye naturally.
- Label clearly – Use short, descriptive text. Avoid jargon unless your audience is familiar with it.
- Test at different sizes – Because these files are vector-based, they scale beautifully. Still, test how they look on mobile screens or printed materials to ensure readability.
Consider using these diagrams as part of a larger visual storytelling strategy. Pair them with charts, timelines, or flowcharts to build a cohesive visual narrative that supports your message.
Applications for Different Platforms
One of the biggest advantages of this package is its flexibility across formats and platforms. Here’s how different users can apply these diagrams effectively:
- Bloggers and Content Creators – Use diagrams to enhance how-to guides, explain processes, or summarize research.
- Marketers and Social Media Managers – Create shareable infographics, carousel posts, or email visuals that explain product benefits or campaign strategies.
- Entrepreneurs and Startups – Present business models, product development cycles, or internal workflows in pitch decks or investor reports.
- Educators and Trainers – Build visual lesson plans or interactive learning modules that help students retain information better.
- Designers and Developers – Incorporate diagrams into UI/UX designs, dashboards, or data visualization tools.
Because you receive multiple file types, you can easily adapt the diagrams for both print and digital use. SVG files work great on websites, while PDFs and AI files are ideal for print design or high-end presentations.
Staying Organized and Consistent
When working with multiple diagrams or integrating them into a larger project, consistency is key. Here are some tips to keep your visuals organized:
- Use a style guide – Define your color palette, font choices, and layout rules to maintain uniformity.
- Group related diagrams – If you’re using several diagrams in one document, group them visually so they feel connected.
- Save custom versions – After editing a diagram to fit your brand, save it as a new file so you can reuse it across projects.
- Optimize for accessibility – Ensure color contrast meets accessibility standards and consider adding alt text for screen readers when used online.
By treating your diagrams as part of a visual system rather than isolated graphics, you’ll create a more polished and professional outcome.
Real-World Examples and Project Ideas
Let’s look at some practical ways you can apply these diagrams today:
- Content Marketing – Create a visual guide to your content creation process and share it on your blog or social media.
- Online Courses – Use a process diagram to outline the structure of your course or module progression.
- Internal Communication – Share a flowchart of your team's project management workflow in a company handbook or onboarding guide.
- Product Launches – Illustrate the development timeline or user journey to help stakeholders understand your strategy.
- Print Materials – Incorporate diagrams into brochures, reports, or posters for visual clarity and engagement.
These are just a few starting points. With 100 vector diagrams at your disposal, the possibilities expand with each new project you take on.
Final Thoughts: Creativity Meets Clarity
Process Diagram Infographics aren’t just about looking good—they’re about making complex ideas easy to understand. Whether you're a designer, marketer, educator, or entrepreneur, these visuals help you communicate more effectively and professionally.
With the right tools and a bit of creative thinking, you can turn abstract processes into engaging visuals that resonate with your audience. And with this package’s high-quality formats and transparent backgrounds, you have the freedom to make each diagram your own—no matter the size, style, or platform.
If you're looking for a way to elevate your visual storytelling and streamline your communication, Process Diagram Infographics offer a powerful, flexible solution that grows with your creative needs.